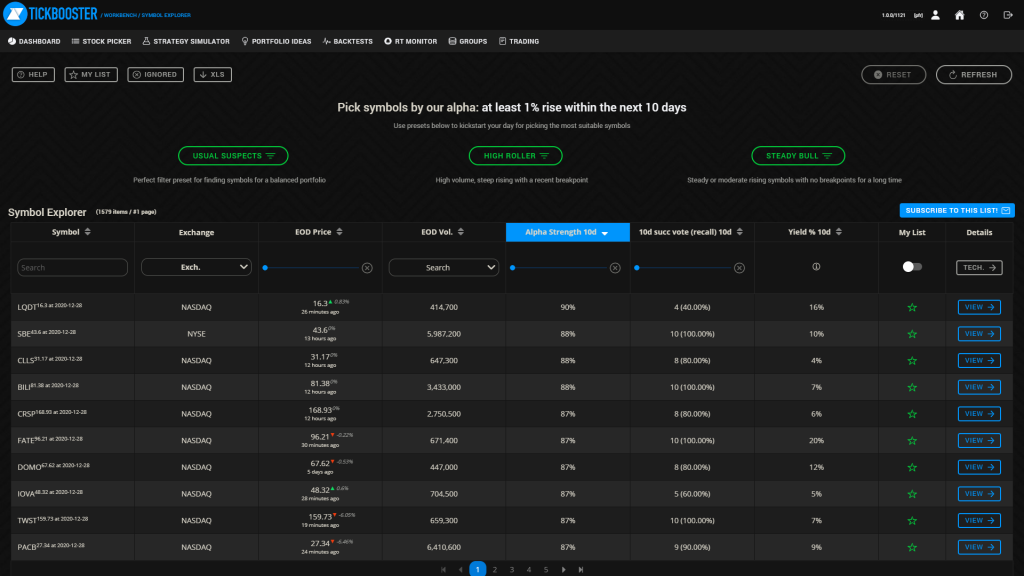
Stock picker interface lets you find stock items for today based on multiple criterias according to your preferences. Each stock has many parameters that are represented by columns. Each column is filterable and also sortable. With this method you can easily setup a filter that best matches the stocks you usually trade. However the main and most important column is the prediction strength, this indicates that how likely is it for a stock to rise at least 1% within the next 10 trading days.
Note: Some user levels might have additional set of prediction signals that are selectable from the interface.
Subscribe to a filter set
Once you have configured your top list of stocks, a SUBSCRIBE TO THIS LIST button appears. Just click on it and you will have this list land in your inbox every day. You can also unsubscribe from this list in the Profile/Notifications section.
Columns
Main tab
Symbol
This is the name of the stock. You can do text search with this filter.
Exchange
This is the name of the stock. You can do a drop-down with text search with this filter.
EOD price and stock trading
Last days closing price. Filterable using range sliders. Next to the price if there are freshly pulled prices for the stock, you can see them as well. The prices might be delayed up-to 15 mins, but the last price refresh time is indicated below the price. Be aware that once you pick a stock for long buy, always consider setting buy limit. It would make no sense to buy a $100 stock predicted to rise over $101 in the next 10 days at market price of $102. Also it would not make sense to purchase a stock that has an intraday price drop due to extrinsic news.
EOD volume
Last days closing volume. Filterable using range sliders.
Prediction strength
How certain is it for this stock that you can take 1% profit for the next 10 trading days. Filterable using range sliders.
Note: Some user levels might have additional set of prediction signals that are selectable from the interface.How can you use this information?
Easy: you just need to make two orders: buy limit of $100 and a take profit of $101. After the expiration of the 5 days you can also take any profit for best yield.
How prediction strength affects the outcomes?
For example an prediction of 50% is less likely to catch any increase peak within the prediction distance, however an prediction over 60% will make sure that you will be able to take a profit around 1%.
Success and vote recall
Success means from the last 10 predictions how many were successful. Recall means from the last 10 trading period how many times did the system even predicted over 50% confidence. For example if we have 10 days of prediction in which we predicted a rise over 50% 3 times, than our recall factor is 30%. If, from that 3 occasions we were accurate and our prediction actually happened, our success rate will be 2/3 = 66.7%
Yield
This is a quick indicator of a given stocks 10 day (completed prediction distance) yield if we listened to the prediction strength and purchased/not purchased the stock.
A prediction means completed if the day of the prediction and the day of the last known price has at least prediction distance amount of days in between. Its like we predict a stock to rise within the next 10 trading days in 12. january, then we cannot say the prediction failed or succeeded on 13. january, because the prediction is not completed. But on 27 january we will have a completed prediction distance and we can validate the prediction of the prediction.
My List
Each stock can be added to your list. Once a stock is added to your list you can use the starred filter on the top left side of the GUI. This will only show those stocks that you have already starred.
What can I do with the starred stocks?
- You can run simulations on your set of stocks
- When you set starred filter active another table pops up at the bottom showing the prediction statistics of your selected set of stocks
Technical Tab
Breakpoint distance
Indicates how far is the stock price in days from the last breakpoint in trend. Useful to filter for hectical stocks, stable stocks or stocks with a recent shift in trend direction
Streak trend
Indicates the last segment (trendline from breakpoint) gradient
10 Day Trend – Linear Regression
Indicates the last segment (trendline from breakpoint) gradient
Once you have activated starred switch, only the stocks that you have previously added to your favorites will be displayed in the list. For better understanding the behavior of our AI and prediction working on a set of symbols a simple statistics is displayed below the stock list. Click here for more information on the backtest sheet.
