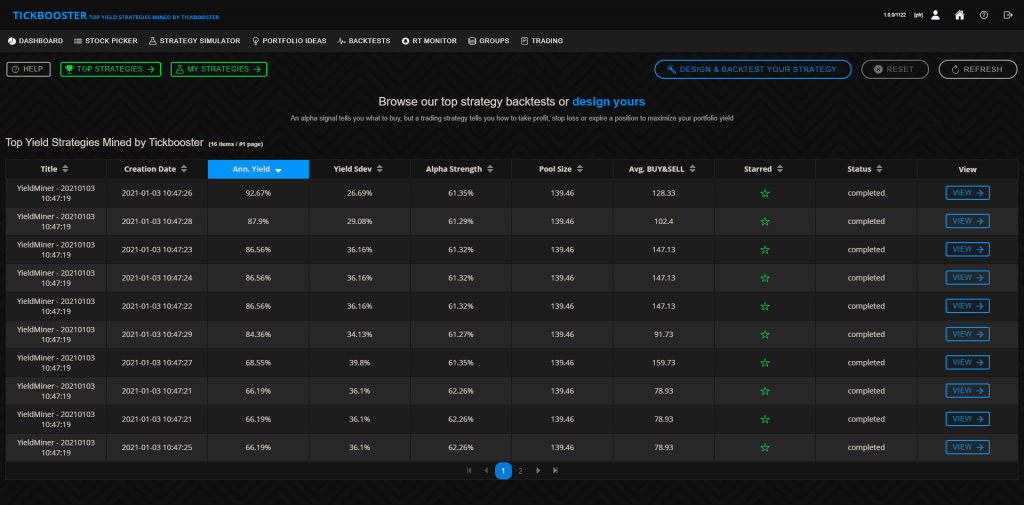
Each simulation – automated backtest or your own – are displayed in a list so you can order and filter the list to see best or worst strategies.

Columns
Title
Automated title in case of automated backtest or the title you have added when designed your own
Ann. Yield
Mean of annualized yields of all iterations contained in the strategy simulation
Yield Stdev
Standard deviation of the yield divided by the yield mean
Prediction Strength
Mean of the prediction strength used for decision making within the simulation
Pool size
Mean of the candidate pool size used in the simulations. A pool size of 50 means for each iteration the algorithm found around 50 stocks that were within the given prediction strength range. The smaller the pool size the larger the canche of a less robust conclusion
Avg. Buy & Sell
Mean of total buy&sell pairs of each iteration. If there are only a pool sized number of transactions we should look at the trading charts to see the distribution of the purchases for each day because it can mean that all trades were done at the beginning and the end of the periods which is a non robust strategy
Starred
You can add an automated backtest to your own experiments list
Status
A strategy needs some time to run and Tickbooster displays it’s status according to the level of readyness. Statuses are pending (not started processing), processing and completed