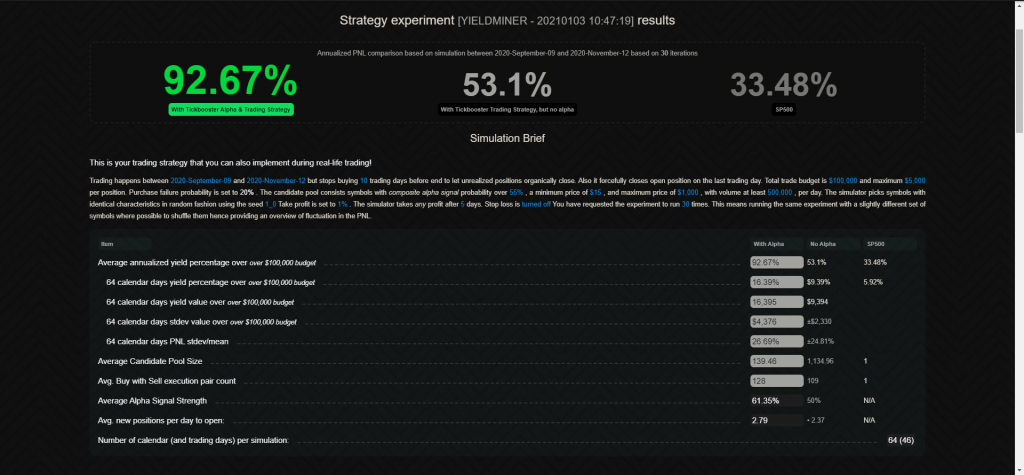
An experiment page displays all information regarding the aggregate result of all iterations and per iteration details, hence it has 2 main componens: Summary and Iterations list.
Summary section

Yield summary
Yield summary indicates the yield result of the simulation for the 3 main simulation type:
With prediction: this means our simulator only opens a position if the prediction strength is above the required threshold
Without prediction (blindmode): this means our simulator uses the same trading parameters for the simulation but for prediction it picks stocks randomly
SP500: this means the simulator buys sp500 at the beginning of the period and closes the position at the end
Simulation Brief
Simulation brief clearly explains how the trading algorithm was executed and what parameters were used for specific thresholds.
Simulation details summary
Detailed 3 component (prediction, no prediction, SP500) list of main qualitative and quantitative results of the simulation iterations. Placeholders might appear red if values are look non-satisfactory to consider the total simulation valid.
Trade details list
Trade details for each iteration is displayed in a sheet. Main parameters of the iterations are displayed accordingly with a second line that indicates non-prediction a.k.a blindmode results.
Trading chart – Tickbooster PNL vs SP500
Displays day-by-day aggregated PNL comparison of the experiment. The comparison is between the 3 main simulation types: with prediction, no prediction and SP500 single buy-sell.

Trading chart – Complete Trading Analytics
This chart shows the complete analytics of the trading and its respective parameters.
BOT/SLD
Shows how much securities were traded at that day. On the chart below you can see that on the first day, the full budget was spent and then buy and sell amounts were fluctuating until two weeks before the end when the simulator stops opening new positions to allow relaxation (expiration) close of the openet positions.
Sum gross Pos
The total value of positions on the given day
Realized
The realized cumulated yield at the given day (if negative, red border is around)
Unrealized
The unrealized cumulated yield at the given day (if negative, red border is around)
Cumulated PNL
The total cumulated PNL at the given day (if negative, red border is around)

The trading chart shows how this simulator started the trading than it gradually maintained a gross position around the maximum budget but gradually increased PNL. Because of the two weeks relaxation padding period, the simulator stopped opening new positions and started burning down the existing ones. According to the brief of this simulator there was no STOP LOSS set but an 1% TAKE PROFIT and a TAKE ANY PROFIT after 5 days setting was active.